Blog Post 0 - Visualization For Peguins Dataset
In this blog post, we are going to create a visualization using the palmer penguins data set. The following tutorial will guide you to create this interesting visualization!
1. Imports
First, we load the packages we may use in this post.
import pandas as pd
import numpy as np
from matplotlib import pyplot as plt
import seaborn as sns
2. Pre-Processing & Data Cleanning
Then, we get the penguin data. We are using the data from palmer_penguins.csv which contains observations of penguin features from various studies. We have 344 penguins, with 17 features each (including some NaNs).
url = 'https://philchodrow.github.io/PIC16A/datasets/palmer_penguins.csv'
penguins = pd.read_csv(url)
#checking first 5 rows of our data
print(penguins.shape)
penguins.head()
(344, 17)
| studyName | Sample Number | Species | Region | Island | Stage | Individual ID | Clutch Completion | Date Egg | Culmen Length (mm) | Culmen Depth (mm) | Flipper Length (mm) | Body Mass (g) | Sex | Delta 15 N (o/oo) | Delta 13 C (o/oo) | Comments | |
|---|---|---|---|---|---|---|---|---|---|---|---|---|---|---|---|---|---|
| 0 | PAL0708 | 1 | Adelie Penguin (Pygoscelis adeliae) | Anvers | Torgersen | Adult, 1 Egg Stage | N1A1 | Yes | 11/11/07 | 39.1 | 18.7 | 181.0 | 3750.0 | MALE | NaN | NaN | Not enough blood for isotopes. |
| 1 | PAL0708 | 2 | Adelie Penguin (Pygoscelis adeliae) | Anvers | Torgersen | Adult, 1 Egg Stage | N1A2 | Yes | 11/11/07 | 39.5 | 17.4 | 186.0 | 3800.0 | FEMALE | 8.94956 | -24.69454 | NaN |
| 2 | PAL0708 | 3 | Adelie Penguin (Pygoscelis adeliae) | Anvers | Torgersen | Adult, 1 Egg Stage | N2A1 | Yes | 11/16/07 | 40.3 | 18.0 | 195.0 | 3250.0 | FEMALE | 8.36821 | -25.33302 | NaN |
| 3 | PAL0708 | 4 | Adelie Penguin (Pygoscelis adeliae) | Anvers | Torgersen | Adult, 1 Egg Stage | N2A2 | Yes | 11/16/07 | NaN | NaN | NaN | NaN | NaN | NaN | NaN | Adult not sampled. |
| 4 | PAL0708 | 5 | Adelie Penguin (Pygoscelis adeliae) | Anvers | Torgersen | Adult, 1 Egg Stage | N3A1 | Yes | 11/16/07 | 36.7 | 19.3 | 193.0 | 3450.0 | FEMALE | 8.76651 | -25.32426 | NaN |
In this post, we are going to create a visualization using columns “Species”, “Culmen Length (mm)”, “Culmen Depth (mm)”. Thus, we select only these three columns from the penguins data set and we drop the NAs.
# Select only these three columns from the penguins data set
df = penguins[["Species", "Culmen Length (mm)", "Culmen Depth (mm)"]]

# drop the NA values
df = df.dropna()
# Visualize the new dataframe
df.head()
| Species | Culmen Length (mm) | Culmen Depth (mm) | |
|---|---|---|---|
| 0 | Adelie Penguin (Pygoscelis adeliae) | 39.1 | 18.7 |
| 1 | Adelie Penguin (Pygoscelis adeliae) | 39.5 | 17.4 |
| 2 | Adelie Penguin (Pygoscelis adeliae) | 40.3 | 18.0 |
| 4 | Adelie Penguin (Pygoscelis adeliae) | 36.7 | 19.3 |
| 5 | Adelie Penguin (Pygoscelis adeliae) | 39.3 | 20.6 |
# Examine the dataframe
df.describe()
| Culmen Length (mm) | Culmen Depth (mm) | |
|---|---|---|
| count | 342.000000 | 342.000000 |
| mean | 43.921930 | 17.151170 |
| std | 5.459584 | 1.974793 |
| min | 32.100000 | 13.100000 |
| 25% | 39.225000 | 15.600000 |
| 50% | 44.450000 | 17.300000 |
| 75% | 48.500000 | 18.700000 |
| max | 59.600000 | 21.500000 |
# Examine the counts of species
df["Species"].value_counts()
Adelie Penguin (Pygoscelis adeliae)          151
Gentoo penguin (Pygoscelis papua)            123
Chinstrap penguin (Pygoscelis antarctica)     68
Name: Species, dtype: int64
3. Create a Scatterplot
For our visualization, we made a scatterplot of x=culmen length, y=culmen depth, and color-coded by species. We utilized seaborn to draw this plot.
fgrid = sns.relplot(x = "Culmen Length (mm)",
                    y = "Culmen Depth (mm)",
                    hue = "Species",
                    data = df,
                    palette=["b", "r", "g"]).set(title=
                          'Figure 1: Culmen Length vs Culmen Depth by Species')
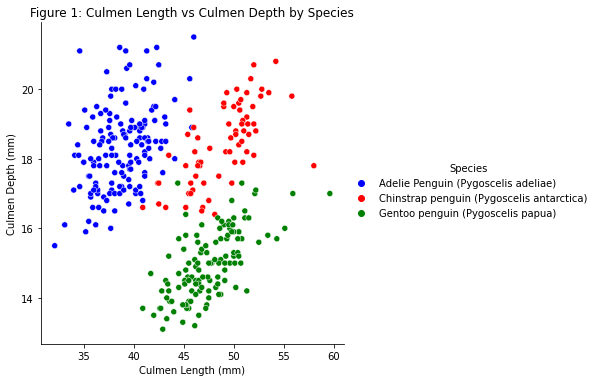
Analysis: This scatterplot shows the correlation of Culmen Length and Culmen depth by species. Culmen length and Culmen Depth are positively correlated within each species. These features may be useful for classifies penguins’ species because there are three distinct clusters by species. Gentoo has the least culmen depth, Adelie has the least culmen length, and Chinstrap has the greatest culmen length and depth.